 cc315dcc8c
* perf(db): keep query planner statistics trustworthy with full ANALYZE

PRAGMA optimize's internal ANALYZE runs with a limited analysis budget
(~2000 rows) that writes wrong sqlite_stat1 entries for low-cardinality
indexes: on a 96K-track library it claimed (missing, library_id) narrows
to ~2000 rows when it matches the whole table. The planner then prefers
that index over the sort index and falls back to a full-table temp
B-tree sort per request, turning paginated song listings into
multi-second queries (reproduced at 5.5s on real hardware; ~90x slower
than with correct stats). Every index-creating migration re-triggered
the poisoning via the post-migration optimize, and the daily optimizer
could re-trigger it on large library changes. Setting analysis_limit on
the connection does not help: optimize ignores it.

Run a plain full ANALYZE instead: after migrations with schema changes,
and in db.Optimize (daily schedule and scan-end). Stats are stored in
the database file, so one connection suffices and the per-connection
pool loop is gone. The Optimize call at shutdown is removed: stats are
maintained at migration/scan/daily points, and an ANALYZE during
shutdown only delays it and races container stop timeouts.

* perf(db): drop startup PRAGMA optimize that re-poisons planner stats

The startup PRAGMA optimize=0x10002 runs SQLite's budget-limited internal
ANALYZE (bit 0x02), which writes truncated sqlite_stat1 rows for
low-cardinality indexes -- the exact statistics-poisoning this PR set out to
eliminate. Because DevOptimizeDB defaults to true, a restart with no pending
migrations would re-poison the planner until the next scan or daily Optimize.

Remove it: statistics are already refreshed with a full ANALYZE after
schema-changing migrations (Init) and via Optimize at scan-end and on the daily
schedule, so nothing on the startup path needs to touch them. Also clarify that
Optimize is a no-op unless DevOptimizeDB is enabled.

* chore(db): remove the DevOptimizeDB flag and skip Optimize on quick scans

The flag only gated the optimize/ANALYZE maintenance calls and there is
no reason to leave planner statistics unmaintained; the guards are gone
along with the flag. The scan-end Optimize now runs only after full
scans — quick scans barely move the statistics, and the daily schedule
covers drift.

* style(scanner): drop redundant comment in runOptimize

* chore(persistence): drop the no-op PRAGMA optimize from ScanEnd

Mask 0x10000 only selects candidate tables by size change; without the
0x02 action bit optimize does nothing (verified: sqlite_stat1 stays
stale after a 100x table growth). The scan-end statistics refresh is
db.Optimize's full ANALYZE, and the expression-collation-index concern
the old comment guarded against no longer applies.

* fix(scanner): run the post-scan ANALYZE in the server process

With the external scanner (the default), the scan pipeline runs in a
subprocess, so its ANALYZE was invisible to the server: SQLite loads
sqlite_stat1 into the process's shared schema cache, and an ANALYZE from
another process does not refresh it — verified with the production DSN
that even brand-new pool connections keep planning with the old
statistics until the server restarts. An in-process ANALYZE, by
contrast, is immediately visible to every pooled connection through the
same shared cache.

Move the full-scan Optimize from the scanner pipeline to the scan
controller, which always runs in the server process.

* fix(scanner): honor promoted full scans in the optimize gate

A quick scan resuming an interrupted full scan is promoted inside the
scanner (possibly in a subprocess); mirror the promotion in the
controller so the post-scan ANALYZE isn't skipped.

* refactor: apply cleanup review findings

- drop forceFullRescan's inline ANALYZE: Init already runs a full
  ANALYZE after any migration batch with schema changes, so upgrades
  including a full-rescan migration analyzed the whole DB twice
- resumingFullScan uses a filtered CountAll instead of fetching and
  scanning all libraries
- document why CallScan (CLI) deliberately skips the post-scan Optimize

* perf(db): make planner analysis maintenance resilient

Check analysis freshness every 30 minutes and refresh statistics when the last successful run is over 24 hours old or a scan marked them pending. Persist successful analysis state, retry skipped or failed maintenance, coordinate checks with scans, and cover standalone CLI full scans.

* perf(db): avoid analyzing routine quick-scan changes

Reserve pending analysis for full scans, unscanned libraries, and retry state. Incremental quick scans now rely on the 24-hour freshness window instead of triggering a full ANALYZE at the next maintenance check.

* fix(scan): analyze resumed full scans in CLI

* fix(db): back off failed analysis retries

* feat(db): allow disabling scheduled analysis

* test(db): remove redundant analysis coverage

* refactor(db): split ANALYZE maintenance into optimize.go and dedupe call sites

- move query-planner statistics code from db.go to its own optimize.go
  (and matching optimize_test.go)
- log ANALYZE elapsed time inside Optimize/OptimizeIfNeeded instead of
  repeating the timing block at every call site
- drop the LastDBAnalyzeAttemptAt write on success: it is only read
  while failures >= 1, and every failure rewrites it first
- extract runPostScanAnalysis (cmd) and anyIncludedLibrary (scanner)
  helpers

Navidrome Music Server 








Navidrome is an open source web-based music collection server and streamer. It gives you freedom to listen to your music collection from any browser or mobile device. It's like your personal Spotify!
Note: The master branch may be in an unstable or even broken state during development.
Please use releases instead of
the master branch in order to get a stable set of binaries.
Check out our Live Demo!
Any feedback is welcome! If you need/want a new feature, find a bug or think of any way to improve Navidrome, please file a GitHub issue or join the discussion in our Subreddit. If you want to contribute to the project in any other way (ui/backend dev, translations, themes), please join the chat in our Discord server.
Installation
See instructions on the project's website
Cloud Hosting
PikaPods has partnered with us to offer you an officially supported, cloud-hosted solution. A share of the revenue helps fund the development of Navidrome at no additional cost for you.

Features
- Handles very large music collections
- Streams virtually any audio format available
- Reads and uses all your beautifully curated metadata
- Great support for compilations (Various Artists albums) and box sets (multi-disc albums)
- Multi-user, each user has their own play counts, playlists, favourites, etc...
- Very low resource usage
- Multi-platform, runs on macOS, Linux and Windows. Docker images are also provided
- Ready to use binaries for all major platforms, including Raspberry Pi
- Automatically monitors your library for changes, importing new files and reloading new metadata
- Supports lyrics from sidecar .ttml, .yaml/.yml Lyricsfile, .elrc, .lrc, .srt, .txt files and embedded TTML, Enhanced LRC, LRC, SRT, and plain-text tags (via
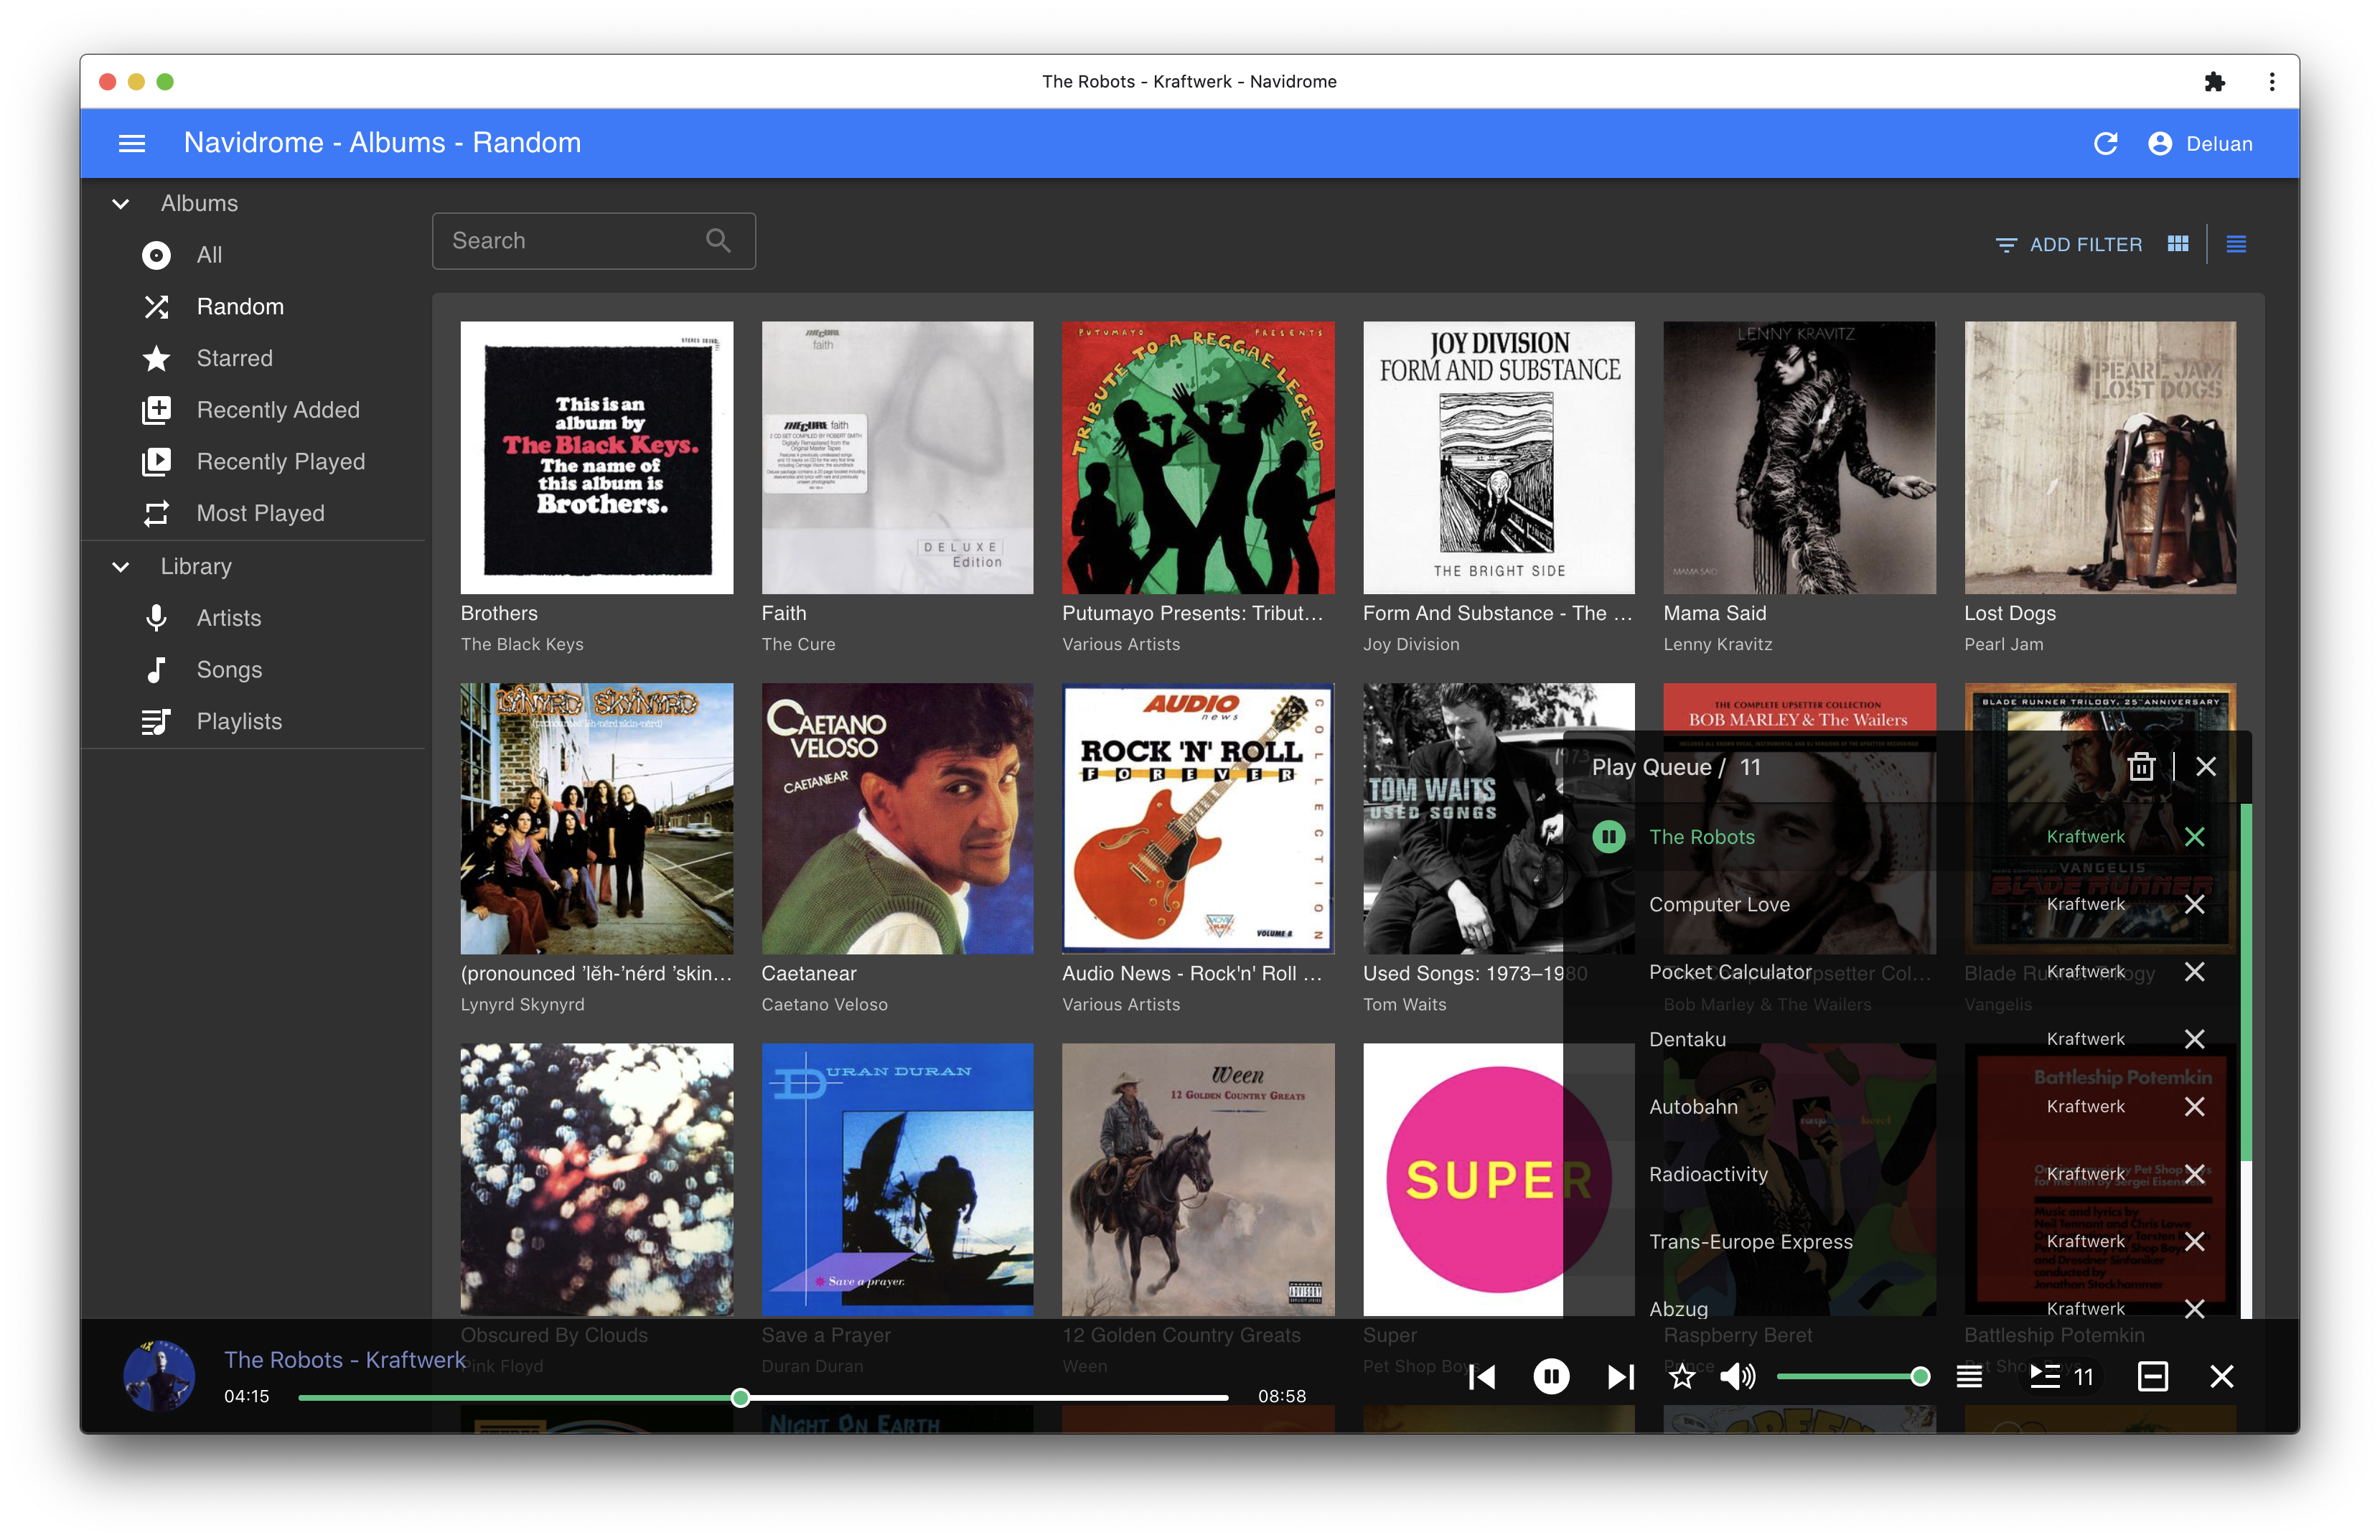
lyricspriority) - Themeable, modern and responsive Web interface based on Material UI
- Compatible with all Subsonic/Madsonic/Airsonic clients
- Transcoding on the fly. Can be set per user/player. Opus encoding is supported
- Translated to various languages
Translations
Navidrome uses POEditor for translations, and we are always looking for more contributors
Documentation
All documentation can be found in the project's website: https://www.navidrome.org/docs. Here are some useful direct links:
Screenshots